Kubernetes 使用 prometheus 集群资源监控
概述
监控指标
一个好的系统,主要监控以下内容
集群监控:即对 k8s 集群本身的监控,主要监控以下内容。
节点资源利用率:集群中每个节点的 CPU 资源使用情况、利用率等;节点数:比如说集群共有三个节点,有两个处于忙碌状态,一个节点处于空闲状态,那么在资源分配时就需要节点数进行考虑;集群中运行的pods:每个节点中运行的 pod 数量等。
Pod 监控:监控集群中运行的 pod 以及容器,主要监控以下内容。
容器指标:pod 中运行的容器数量及状态等;应用程序:对容器中运行的应用程序进行监控,可知晓当前集群的运行情况;
监控平台
使用 Prometheus(普罗米修斯) + Grafana 搭建监控平台
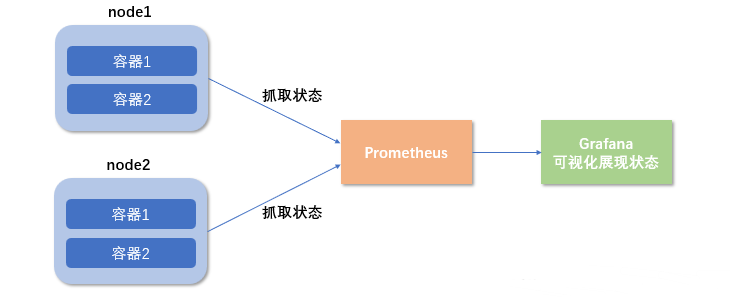
Prometheus(普罗米修斯) 是一套开源组件,可以做到监控、报警功能且集成了时间序列数据库。其基本原理是通过 http 协议周期性抓取被监控组件的状态,这样做的好处是任意组件只要提供 http 接口就可以接入监控系统,不需要任何 sdk 或者其他的复杂集成过程。
Grafana 是一个开源的数据分析和可视化工具,有着非常好的图表和布局展示,包含功能齐全的度量仪表盘和图形编辑器。支持 graphite、zabbix、influxDB 和 OpenTSDB 作为数据源。它在此处的作用也就是以可视化的形式展现“普罗米修斯”抓取的状态。
部署 prometheus
首先需要部署一个守护进程
1 | |
然后执行下面命令
1 | |
创建完成后的效果
1 | |
然后通过yaml的方式部署prometheus
- configmap:定义一个configmap:存储一些配置文件【不加密】
- prometheus.deploy.yaml:部署一个deployment【包括端口号,资源限制】
- prometheus.svc.yaml:对外暴露的端口
- rbac-setup.yaml:分配一些角色的权限
下面我们进入目录下
1 | |
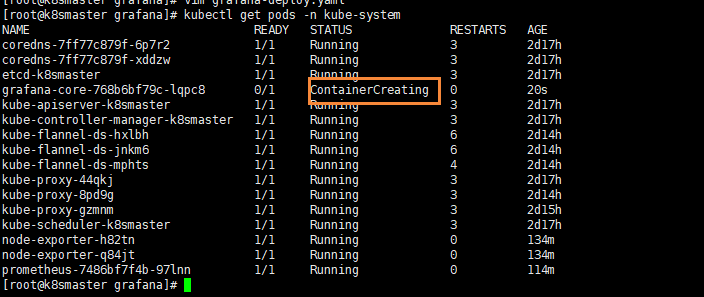
部署完成后,我们使用下面命令查看
1 | |
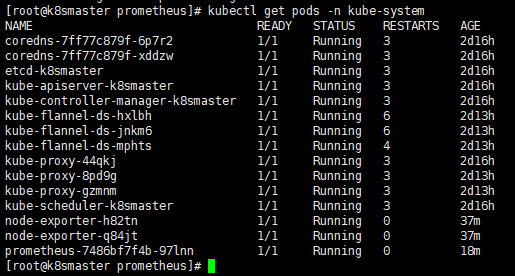
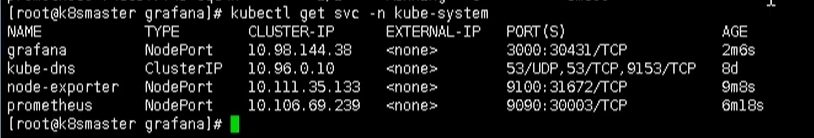
在我们部署完成后,即可看到 prometheus 的 pod了,然后通过下面命令,能够看到对应的端口
1 | |
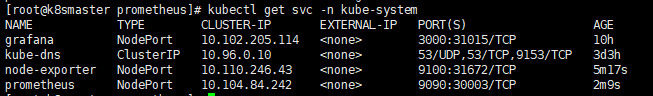
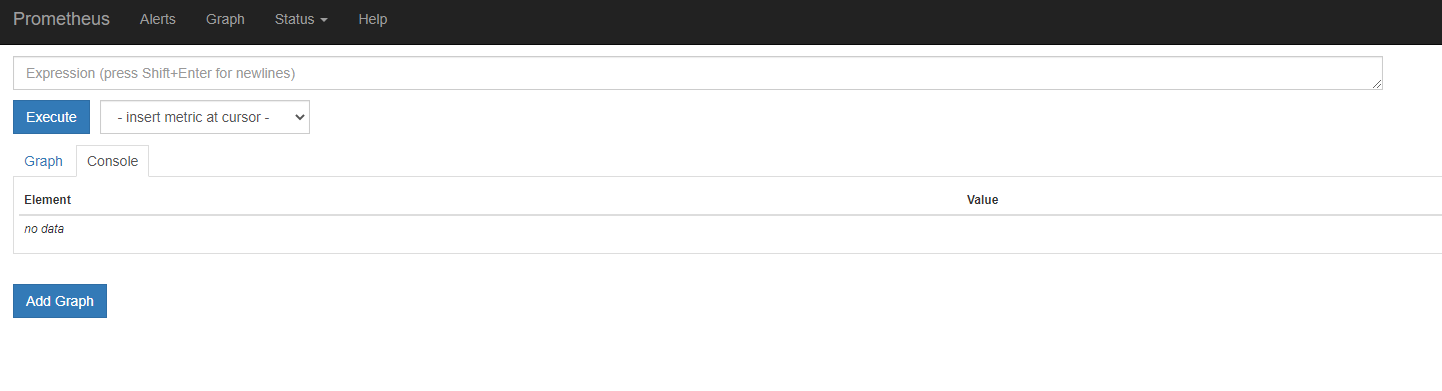
通过这个,我们可以看到 prometheus 对外暴露的端口为 30003,访问页面即可对应的图形化界面
1 | |
部署 grafana
1 | |
我们能看到,我们的grafana正在
配置数据源
下面我们需要开始打开 Grafana,然后配置数据源,导入数据显示模板
1 | |
我们可以通过 ip + 30431 访问我们的 grafana 图形化页面
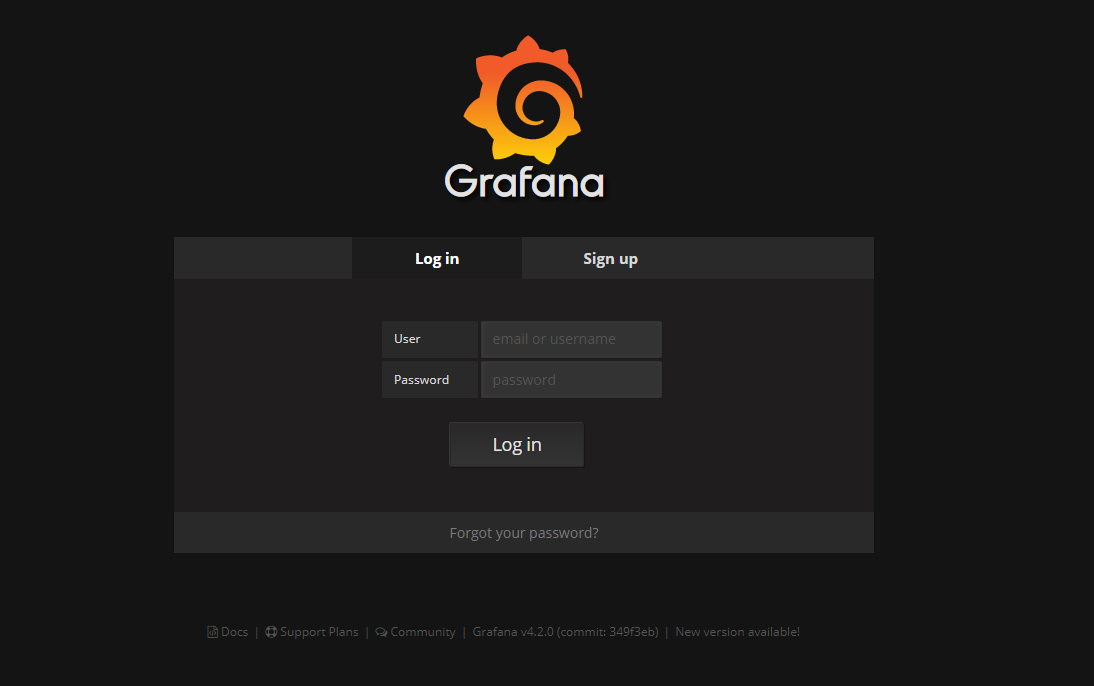
然后输入账号和密码:admin admin
进入后,我们就需要配置 prometheus 的数据源
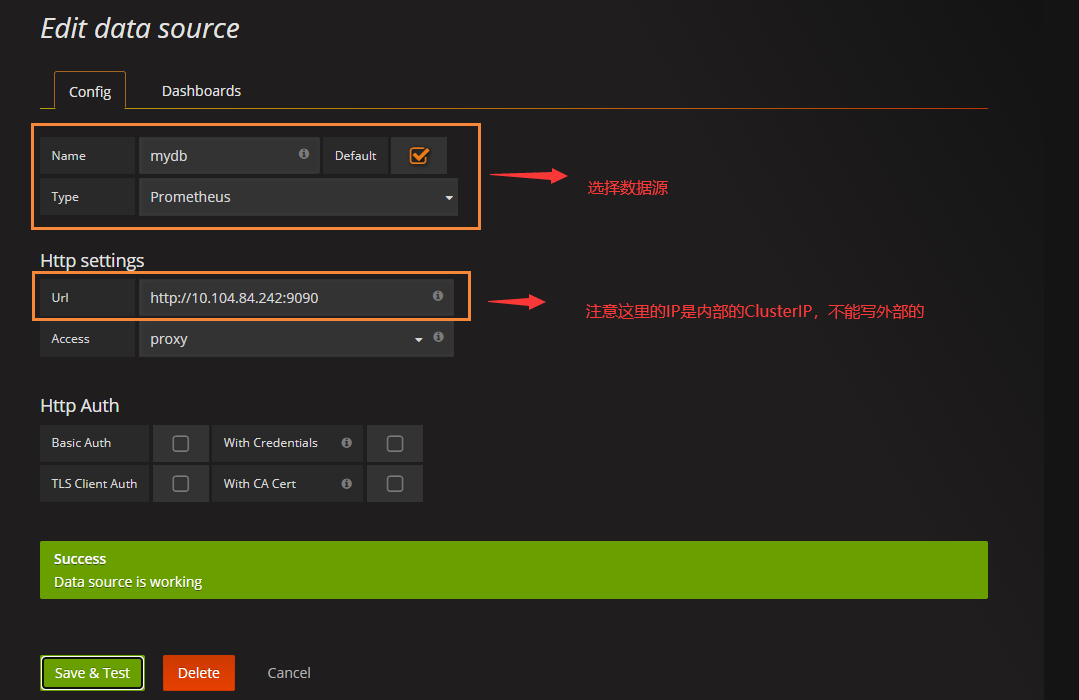
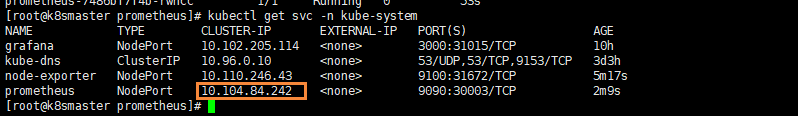
和 对应的IP【这里IP是我们的ClusterIP】
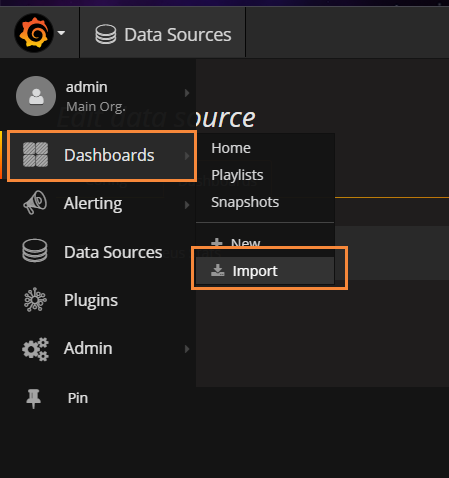
设置显示数据的模板
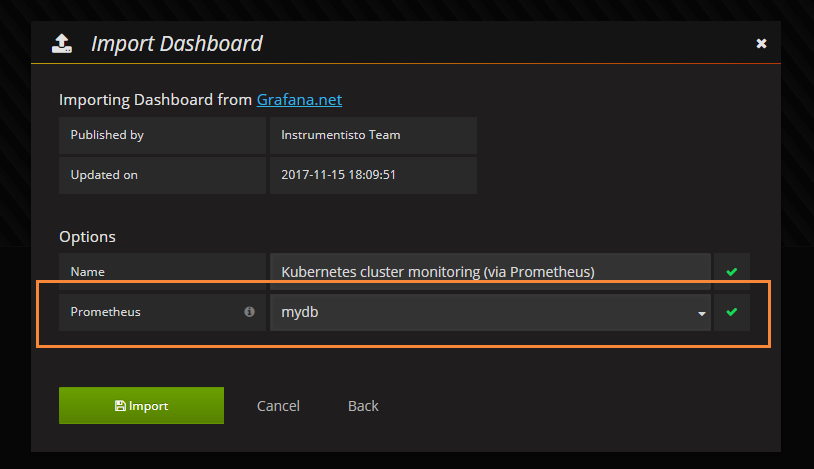
选择Dashboard,导入我们的模板
然后输入 315 号模板
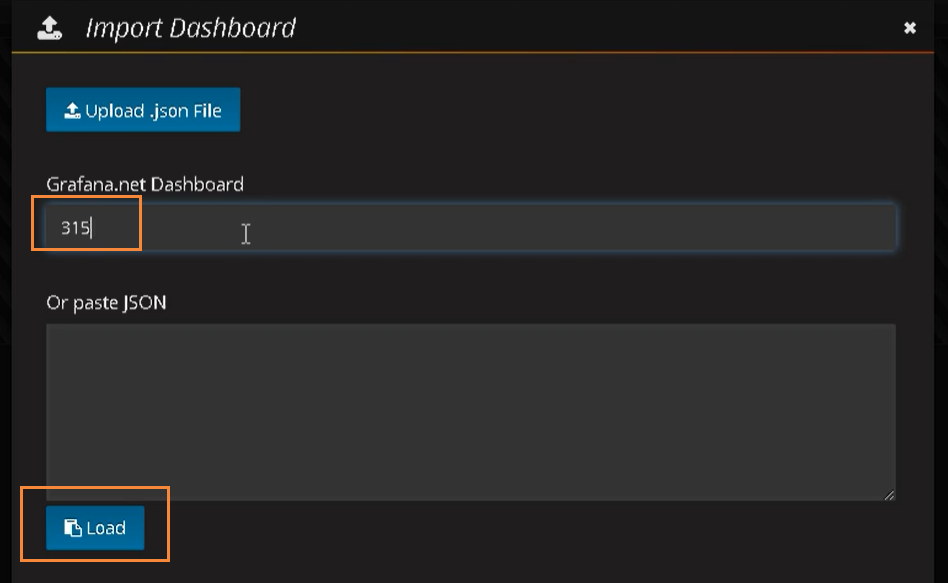
然后选择 prometheus数据源 mydb,导入即可
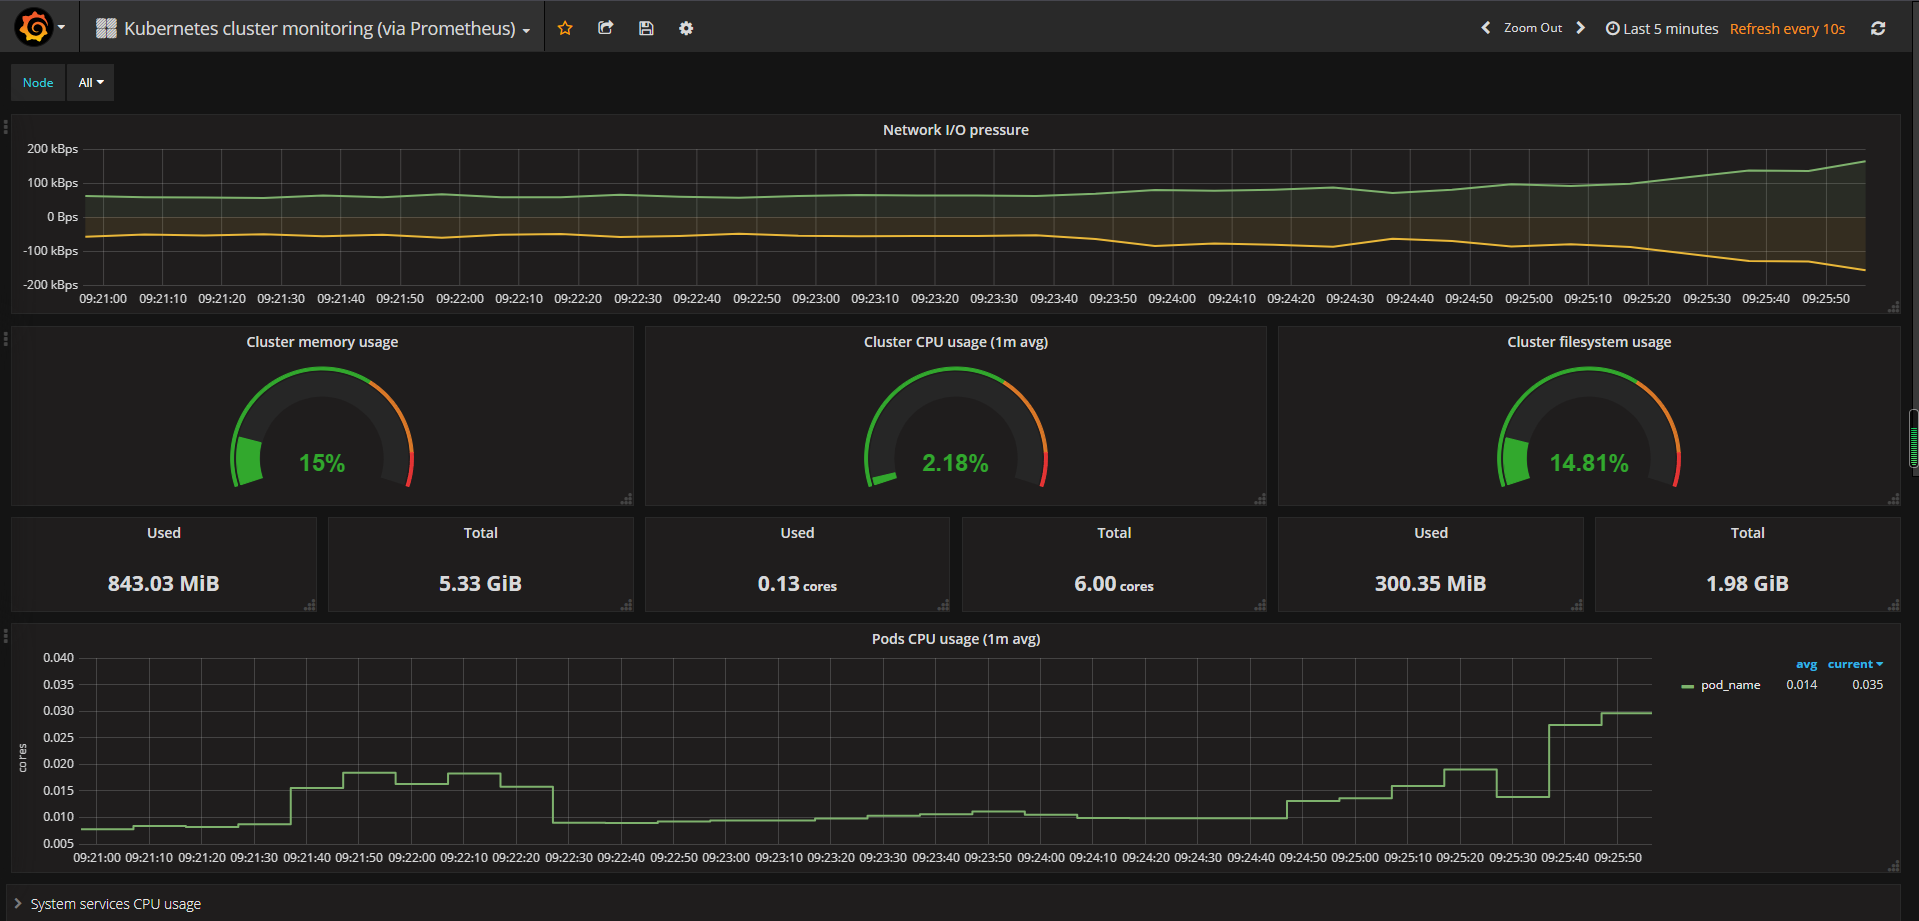
导入后的效果如下所示